Patent Box Statistics 2025: Complete Analysis of HMRC's Latest Data
Relief surges to £1.98 billion as Corporation Tax changes drive unprecedented growth
Contents
- 1. Executive Summary: What Changed in 2023-24
- 2. Year-on-Year Growth: The Corporation Tax Effect
- 3. Company Size Analysis: Why Large Companies Dominate
- 4. Sector Breakdown: Manufacturing Still Leads
- 5. Regional Distribution: London's Commanding Position
- 6. Relief Value Distribution: Concentration at the Top
- 7. What This Means for Your Business
- 8. Data Methodology & Sources
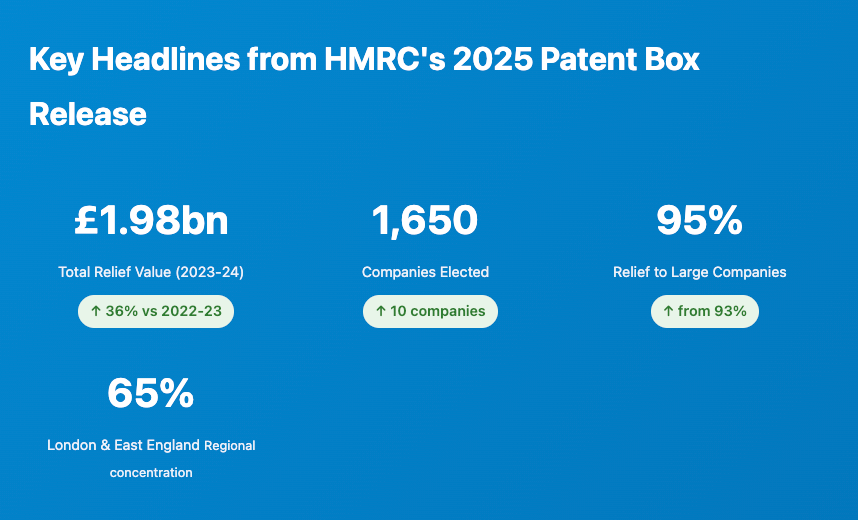
Executive Summary: What Changed in 2023-24
HMRC released its September 2025 Patent Box statistics on 25 September 2025, revealing a transformative year for the UK's premier intellectual property tax incentive. The headline story: relief value jumped 36% to £1.98 billion, driven almost entirely by the Corporation Tax rate increase from 19% to 25% that took effect on 1 April 2023.
This report provides a comprehensive analysis of every data table released by HMRC, with interactive visualizations and insights you won't find elsewhere. All figures are verified directly against the official HMRC publication tables.
The Corporation Tax Rate Change: Why Relief Surged
The Patent Box enables companies to apply an effective Corporation Tax rate of just 10% to profits attributable to qualifying patents, compared to the main rate of 25% for larger companies. This 15 percentage point differential (up from 9 points when the main rate was 19%) explains the dramatic increase in relief value despite minimal growth in company numbers.
Year-on-Year Growth: 11 Years of the Patent Box
Since the Patent Box was introduced in April 2013, the regime has demonstrated steady growth in both company participation and relief value. However, 2023-24 marks an inflection point.
Total Patent Box Relief by Year (2013-14 to 2023-24)
Source: HMRC Patent Box Statistics Table 1, September 2025
Number of Companies Electing into Patent Box (2013-14 to 2023-24)
Source: HMRC Patent Box Statistics Table 1, September 2025
Company participation has plateaued since 2018-19, hovering around 1,600-1,650 companies annually. The 2023-24 figure of 1,650 companies represents just a 0.6% increase (10 additional companies) compared to 1,640 in 2022-23.
Company Size Analysis: The Large Company Dominance Intensifies
One of the most striking features of the Patent Box regime is the extreme concentration of relief among large companies. In 2023-24, this concentration increased further.
| Company Size | Number of Companies | % of Total Companies | Relief Value (£m) | % of Total Relief |
|---|---|---|---|---|
| Large | 460 | 28% | £1,872m | 95% |
| Medium-sized | 455 | 28% | £77m | 4% |
| Small | 425 | 26% | £22m | 1% |
| Micro | 295 | 18% | £5m | <1% |
| Unknown | 15 | 1% | £1m | <1% |
| Total | 1,650 | 100% | £1,977m | 100% |
Source: HMRC Patent Box Statistics Table 3, September 2025 (2023-24 provisional figures)
Relief Distribution by Company Size (2023-24)
Why Do Large Companies Dominate?
Several factors drive this concentration:
- Patent portfolios: Large companies typically hold more patents and exploit them more commercially
- Profitability scale: Patent Box benefits profitable companies; larger firms generate higher patent-related profits
- Resource capacity: The Patent Box calculation is complex; large companies have dedicated tax teams
- International operations: Global companies can allocate more profits to UK-patented technology
Sector Breakdown: Manufacturing Remains the Patent Box Powerhouse
The Patent Box statistics by industrial sector reveal which parts of the UK economy are most actively commercialising patented innovations.
Top 5 Sectors by Number of Companies (2023-24)
Source: HMRC Patent Box Statistics Table 5, September 2025
Manufacturing dominates: With 1,000 companies (61% of the total), the manufacturing sector dwarfs all others in Patent Box participation. This makes intuitive sense—manufacturers frequently patent product innovations and process technologies.
Top Sectors by Relief Value (2023-24)
| Sector | Companies | % of Companies | Relief (£m) | % of Relief | Avg per Company |
|---|---|---|---|---|---|
| Manufacturing | 1,000 | 61% | £816m | 41% | £816k |
| Information & Communication | 75 | 5% | £187m | 9% | £2,493k |
| Wholesale & Retail Trade | 165 | 10% | £125m | 6% | £758k |
| Professional, Scientific & Technical | 150 | 9% | [Suppressed] | 14% (2022-23) | - |
| Construction | 60 | 4% | £5m | <1% | £83k |
Source: HMRC Patent Box Statistics Table 5, September 2025
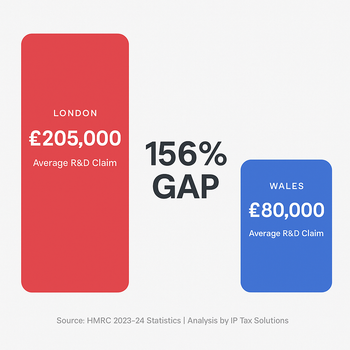
Regional Distribution: London & East England's Dominance
The geographic distribution of Patent Box claims shows significant regional concentration, though it's important to note that HMRC data is based on registered office addresses, which may not reflect where actual R&D or manufacturing activities occur.
Patent Box Relief by UK Region (2023-24)
Source: HMRC Patent Box Statistics Table 7, September 2025
London & East England received 65% of all Patent Box relief (£1,292m of £1,977m) despite accounting for just 21% of companies. This concentration increased slightly from the previous year and reflects both the clustering of large companies' headquarters in these regions and the presence of high-value IP-intensive industries.
| Region | Number of Companies | % of Total | Relief Value (£m) | % of Total Relief |
|---|---|---|---|---|
| London & East England | 345 | 21% | £1,292m | 65% |
| South East | 255 | 16% | £128m | 6% |
| Scotland | 65 | 4% | £118m | 6% |
| West Midlands | 170 | 10% | £91m | 5% |
| North West | 170 | 10% | £81m | 4% |
| Yorkshire & The Humber | 180 | 11% | £57m | 3% |
| Other Regions | 465 | 28% | £210m | 11% |
Source: HMRC Patent Box Statistics Table 7, September 2025
Relief Value Distribution: Extreme Concentration at the Top
Perhaps the most revealing statistic in HMRC's release: just 145 companies (9% of all participants) captured 92% of the total relief by claiming over £1 million each.
Distribution of Companies by Relief Value Band (2023-24)
Source: HMRC Patent Box Statistics Table 9, September 2025
| Relief Band | Companies | % of Companies | Total Relief | % of Total Relief |
|---|---|---|---|---|
| £0 (nil relief) | 165 | 10% | £0m | 0% |
| £1 to £2,000 | 95 | 6% | <£1m | <1% |
| £2,001 to £10,000 | 225 | 14% | £1m | <1% |
| £10,001 to £25,000 | 205 | 12% | £3m | <1% |
| £25,001 to £70,000 | 290 | 17% | £12m | 1% |
| £70,001 to £200,000 | 290 | 18% | £34m | 2% |
| £200,001 to £500,000 | 150 | 9% | £47m | 2% |
| £500,001 to £1,000,000 | 85 | 5% | £62m | 3% |
| More than £1,000,000 | 145 | 9% | £1,816m | 92% |
Source: HMRC Patent Box Statistics Table 9, September 2025
What This Means for Your Business
For Companies Already in Patent Box
If your business is already claiming Patent Box relief, the Corporation Tax rate change has automatically increased your benefit. The 15-point differential between the 10% Patent Box rate and the 25% main rate means you're now saving 15p in tax for every pound of qualifying profit, compared to 9p when the main rate was 19%.
This 67% increase in per-pound benefit makes Patent Box significantly more valuable, particularly for companies with substantial patent profits.
For Companies Considering Patent Box
The widened gap between Patent Box and standard Corporation Tax rates makes now an opportune time to evaluate whether your business could benefit. Key questions to consider:
- Do you have granted patents? The scheme requires UK or certain European patents (Patent Pending applications don't yet qualify for relief but can be prepared in advance)
- Are you profitable on patent-related products? Patent Box benefits profitable companies; loss-makers cannot claim
- Can you track patent-attributable profits? You'll need to identify which revenues and costs relate to your patents
- Have you conducted qualifying R&D? Post-2016 rules require demonstrating UK R&D expenditure (the "nexus fraction")
For SMEs: Overcoming the Barriers
The statistics show SMEs are significantly underrepresented in Patent Box relative to their potential. If you're an SME, consider:
- Patent Box calculations are complex but not insurmountable with proper advice
- You can elect into Patent Box retrospectively (up to two years after qualifying profits arise)
- The relief applies to all qualifying profits, not just UK sales
- Once elected, relief continues automatically in future years
Is Your Business Missing Out on Patent Box Relief?
With the Corporation Tax rate now at 25%, Patent Box offers unprecedented value for companies with patented innovations. IP Tax Solutions specialises in helping innovative businesses identify, structure, and claim Patent Box relief.
Explore Your Patent Box Opportunities →Data Methodology & Sources
Official Data Sources
All data in this analysis is sourced directly from HMRC's Patent Box Relief Statistics: September 2025, published 25 September 2025. This official statistics publication is produced to the professional standards set out in the Code of Practice for Official Statistics.
Key documents referenced:
- Patent Box Relief Statistics: September 2025 (Commentary)
- Patent Box Publication Tables (Excel workbook with 9 data tables)
Data coverage: The statistics include confirmed data for financial years 2013-14 through 2022-23, plus provisional projected statistics for 2023-24. The 2023-24 figures are based on 88% of expected Patent Box elections (those made up to and including July 2025) and will be updated in the Autumn 2026 release.
Important notes:
- Company numbers are rounded to the nearest 5
- Relief amounts are rounded to the nearest £1 million
- Some data is suppressed [x] to meet confidentiality requirements
- Percentages are rounded to the nearest 1%
- Figures may not sum to totals due to rounding and suppression
Geographic data caveat: Regional breakdowns are based on company registered office addresses provided to HMRC for tax purposes. These may not represent where R&D, manufacturing, or other economic activities actually take place.
Company count: All companies that elected into Patent Box are included in company counts, regardless of whether they received relief in that year.