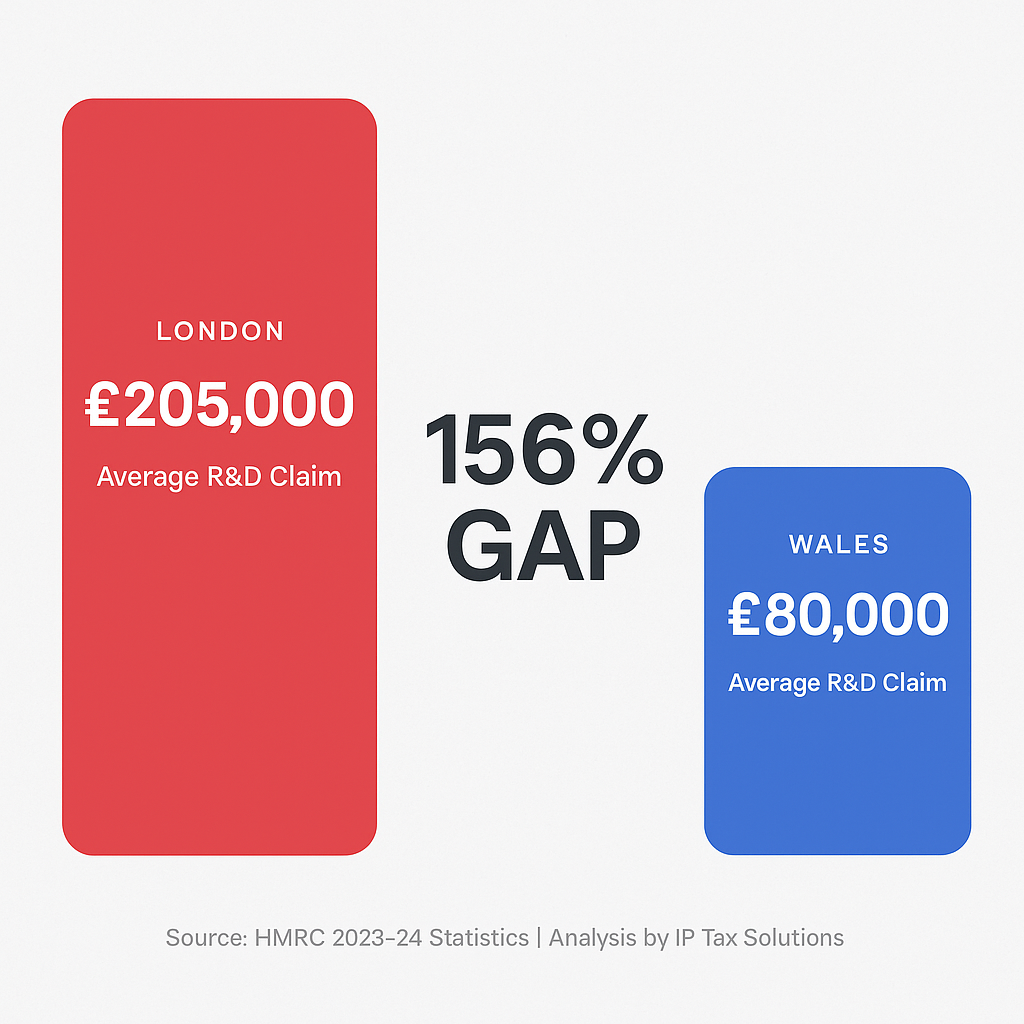
Your company's registered address determines whether you're likely to claim £205,000 or £80,000 in R&D tax relief. HMRC's latest statistics expose a regional divide that's getting wider, not narrower.
One Statistic That Tells The Story
London average R&D claim: £205,000
Wales average R&D claim: £80,000
Difference: 156%
That's not a typo. A London-registered company claims, on average, 2.5 times more R&D relief than a Welsh company. And the gap is growing.
The Regional Reality (HMRC 2023-24 Data)
| Region | Total Relief | Number of Claims | Average Claim |
|---|---|---|---|
| London | £2,320m | 11,335 | £205k |
| South East | £1,475m | 6,940 | £213k |
| East of England | £1,015m | 4,570 | £222k |
| Golden Triangle Total | £4,810m | 22,845 | £211k |
| Wales | £115m | 1,440 | £80k |
| North East | £115m | 1,335 | £86k |
| Yorkshire | £265m | 3,130 | £85k |
The three South East regions capture 64% of all R&D relief despite making up just 49% of claims.
Why This Matters: It's Getting Worse
This isn't just a snapshot - it's a trend accelerating in the wrong direction.
London's share of total UK R&D relief:
- 2021-22: 29%
- 2022-23: 30%
- 2023-24: 31%
Wales, North East, Yorkshire combined:
- 2021-22: 8%
- 2022-23: 7%
- 2023-24: 6%
While government policy talks about "levelling up," R&D tax credits are doing the opposite.
Three Reasons Your Postcode Affects Your Claim
1. Company Size Distribution
London and the South East have disproportionately more:
- Large corporations (RDEC average: £1.08m per claim)
- Well-funded scale-ups (raising £5m+ rounds)
- International HQs (pharmaceutical, tech, finance)
Wales, the North and regional areas have more:
- Traditional SMEs (average claim: £85k)
- Family businesses
- Manufacturing in sub-£5m turnover bracket
The 2023-24 reforms hit smaller claims hardest. When you reduce the SME rate from 14.5% to 10% but increase RDEC from 13% to 20%, you favour large companies over small ones.
2. Sector Composition
London dominates in the highest-value sectors:
- Financial services: £441k average claim
- Life sciences: £250k+ average
- Professional/scientific services: £207k average
Regional UK concentrates in lower-average sectors:
- Manufacturing: £163k average
- Construction: £109k average
- Wholesale/retail: £101k average
Sector mix isn't destiny - but it explains part of the regional gap.
3. Access to Specialist Expertise
London has the highest concentration of R&D tax specialists, which means:
- More competition driving expertise up
- Easier to find sector-specific knowledge
- Established networks and peer learning
Regional areas have fewer specialists, which can mean:
- Needing to work with national firms remotely
- Less local sector-specific expertise
- Potential for longer response times
The key point: Geography matters less than expertise. A top-tier specialist working remotely will deliver better results than a local generalist working in person.
Regional Winners and Losers (Year-on-Year Change)
The Only Bright Spot: West Midlands
Relief up 21.5% (from £465m to £565m)
Why? Manufacturing renaissance. Automotive R&D. JLR, Rolls-Royce and supply chains investing heavily in electrification and advanced materials.
If you're a manufacturing company in Birmingham or Coventry, you're in the right place at the right time.
The Decline: Wales, North East, Yorkshire
All three fell 17-23% year-on-year.
Wales: -23.3% (from £150m to £115m)
North East: -17.9% (from £140m to £115m)
Yorkshire: -17.0% (from £320m to £265m)
Why the collapse?
- Smaller average projects - more claims in the £10-50k range that are no longer economical
- Fewer R&D specialists - companies either DIY (risky) or give up entirely
- Sector decline - construction down 18%, wholesale/retail down 23%
These regions had legitimate R&D happening. The claims didn't stop because innovation stopped - they stopped because smaller claims became less economical under the new compliance requirements.
One Important Caveat
These statistics are based on registered office location, not where R&D actually happens.
A London-registered company doing manufacturing R&D in Sunderland shows up as "London" in these stats.
Remote-first tech companies often register in London because it's administratively easier, even if their team is distributed.
So the regional gap is real but overstated.
The Bottom Line
Your region doesn't determine whether you can claim R&D tax credits, or the quality of support available.
It does correlate with:
- Average claim sizes (£80k vs £205k benchmarks)
- Company size and sector distribution
- Local vs remote specialist relationships
The key insight: regional variations reflect underlying business structures, not inherent advantages or disadvantages in the relief itself.
Focus on:
- Genuine R&D - definitions don't vary by postcode
- Quality documentation - HMRC standards are national
- Specialist support - expertise matters more than geography
- Realistic expectations - use your sector and size as benchmarks, not just region
Interested in what you could realistically claim based on your region and sector? Book a consultation - we'll run the numbers for your specific situation.
This analysis is part of our complete review of HMRC's September 2025 R&D statistics. See the full interactive data analysis.
About the Author: Steve Livingston FCA spent 20+ years advising companies across the UK on R&D tax credits at KPMG and Crowe UK before founding IP Tax Solutions. He's reviewed regional patterns since HMRC first published geographic data in 2016.